


|
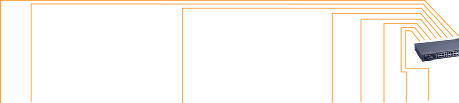
Fibre Optic Ethernet Link |
|
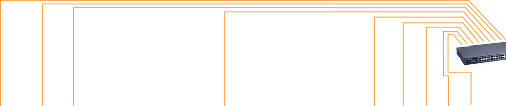
Fibre Optic Ethernet Link |
|
Typical Distributed & Synchronised NetPod 4000 Systems Application |
|
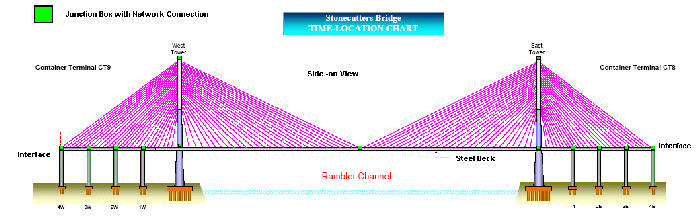
The diagrams below shows how a typical NetPod 4000 distributed networked data acquisition system application is put together allowing for multiple instruments within junction boxes widely spaced upon a single network. The instruments are able to accept a large range of different inputs and are networked locally within a junction box to allow for easy expansion and systems maintenance. All junction box systems are further connected onto a fibre optic network back to a central data analyser PC. |
|
Figure 15 above shows junction boxes containing NetPod 4000 instruments |
|
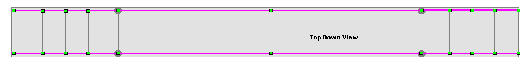
Distributed Junction Boxes |
|
Data Analysis PC |
|
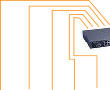
Fibre Optic |
|
To 100BaseT |
|
Network |
|
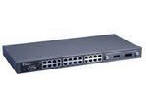
Converter |
|
100BaseT |
|
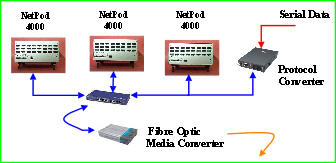
Fig 16 Junction Box Instrumentation Layout |
|
Figure 16 shows how multiple instruments within a junction box are networked together and how they systems are connected onto the fibre optic network. |
|
Junction Box Instrumentation |
|
Network Layout |
|
Fig Z shows fibre optic |
|
Fig 17 |