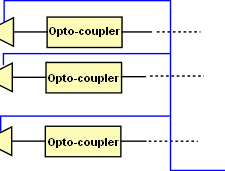
Fig 3
Timing & Synchronisation For NetPod 4000 Instruments
Each NetPod 4003 contains it’s own individual real-time clock and is used to control the timing operations for the data acquisition within the instrument. The instrument clock in collaboration with the clock within the host computer forms the basis for the timing systems used to provide the synchronisation timing within the driver software.
Each NetPod 4003 contains it’s own individual real-
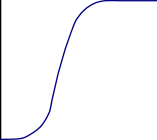
Figure 4 shows the Step Response for the NetPod 4000 digital filter. The filter settles to its steady state level after only 3 samples. The digital filter operations within the NetPod 4003 takes the average, of the average, of the average and presents this as the output value to be used. Apart from being a very good low pass filter, the averaging process ensures a very good signal to noise ratio for signals within the pass band of the instrument. The averaging process also removes false spikes from the input signals.
At 1 KHz sample rate it will take approximately 3 ms for the instrument to go from 0 to Full scale ie from 0V to 50V if using a high voltage card. Fig 6 shows the frequency response of the input channels. The band-pass setting for the filters is simply set by adjusting the instrument sample rate and is the same for input channels within a single instrument.
At 1 KHz sample rate it will take approximately 3 ms for the instrument to go from 0 to Full scale ie from 0V to 50V if using a high voltage card. Fig 6 shows the frequency response of the input channels. The band-
NetPod 4003 Digital Filters
The NetPod 4003 uses a 24 Bit Sigma Delta ADC converter to convert sensor input signals. The sigma delta ADC has in built digital anti-
Even when a number of instruments are are deployed on a network all of the inputs are synchronised and so signals can be directly compared between channels on different systems. This is ideal for largely distributed applications.
Reference time pulse
from processor card
from processor card
ADC Data Link to
Processor card
Processor card
ADC Data Link to
Processor card
Processor card
Chan-0
Chan-1
Chan-15

Fs/4
Fs
1
2
3
0
1
Sample
Frequency Response - Fig 6
Fig 5
Host
Computer
Computer
NetPod 4003
Sync Pulse
Timing Information
dt
Driver Operations
The driver software starts by sending a synchronisation packet across the network. Upon detecting this packet the instrument determines the time difference between its internal clock and the timing information contained within the sync pulse. Once the timing information for an instrument is determined, it is returned back to the driver. See Figure 2.
Host Computer
Hub/Switch


NetPod 4003
Fibre Network

Timing Information
NetPod Clock
NetPod Clock
The time difference for each instrument is sent back to the driver several times a second and its determination is essential in the reconstruction of the input signal within the driver.
Figure 3 demonstrates how the synchronisation packets are sent out to multiple instruments upon a network and timing information returned to the driver software running on the PC. There is a small delay between the Host PC sending the sync packet out across a network before an instrument receives the sync packet and processes it. This delay is related to the distance from the host PC and the number and different types of networks used to connect the system together. The driver effectively recreates the input signals packet by packet using the timing information received back from the instruments.
dt = (Time difference) PC Clock - Instrument
Fig 4