Global Solutions
For widely distributed systems with instruments deployed anywhere within a GPRS network then only a Internet connection will be required to gather information from the instruments no matter where they are located and how they are deployed. Instruments can be deployed globally and all the information easily brought back to a single location for storage and processing.
Local Systems
The database software can be integrated to locally deployed instruments and can be used as the data logger in many applications. It is best deployed when there is a secure fixed site with adequate power is available on a stand-alone dedicated computer system
The most practical method of integrating the database to the locally deployed instrument systems is by reading transmitted data from across the local networks and these can be any combination of SDI-12/RS485 serial port networks, Ethernet and Cable free 2.4 GHz cable free mesh network.
GPRS/GSM Modem Specifications
• Dual Band 900/1800 MHz GM862-GPRS
• Quad Band 850/900/1800/1900 MHz on
GM862-QUAD
• Output Power: Class 4 (2W) at GSM 900 MHz
• Class 1 (1W) at GSM 1800/1900 MHz
• Integrated SIM card reader
• ROSH compliant
• Operating temperature range -20 to +70 Deg C
• Automatic network identification
• Automatic connection
• Remote network data services
• 50 Ohm antenna termination
• Antenna connector - SMA/M
• Pay-as-you-go SIMM card data services
• Dual Band 900/1800 MHz GM862-
• Quad Band 850/900/1800/1900 MHz on
GM862-
• Output Power: Class 4 (2W) at GSM 900 MHz
• Class 1 (1W) at GSM 1800/1900 MHz
• Integrated SIM card reader
• ROSH compliant
• Operating temperature range -
• Automatic network identification
• Automatic connection
• Remote network data services
• 50 Ohm antenna termination
• Antenna connector -
• Pay-
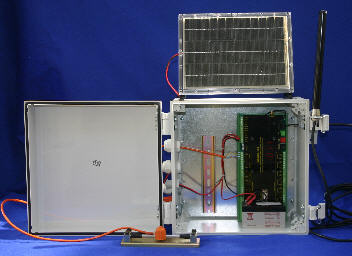
Figure 30 shows everything needed to get 8 channels of vibrating wire sensors onto a GPRS or 2.4 GHz cable free network. The solar panel shown is a 6W cell and this with the battery backup will give 1 reading per hour indefinitely. For short periods the scan rate can be increased for faster sampling.
Flexible Data Scan Operations
The VibWire-108-GPRS unit scans the input channels in a user specified order and transmits the data across the. network. The instrument sends the data out at a specified rate and goes into stand-by mode between scans to save power.
Data-On-Demand
A 2 way network link is established so it is possible to change the scan rate of the instrument when it next makes contact to the database. A User command issued at the console can be used to adjust the scan rate of the remote systems


GPRS Operations
The VibWire-108-GPRS enables true cable free operations to be undertaken any where that a mobile phone network exists and when used in collaboration with the Keynes network database systems.
Information can be gathered and stored into a single database for many instruments deployed upon the GPRS network so long as suitable Internet connection can be made. No longer does a databse have to be located near to or directly connected to the instruments making the measurements.
Database Operations
The Keynes Controls database application utilises the free issue MySQL software and a series of Java applets to gather and format the instrument data into a format suitable for archiving. A wide range of third party add on software is available to support graphical interpretation of data within the database. Keynes Controls can also supply a web server interface


Sensor Frequency Hz
Updated at 10min Interval
Updated at 10min Interval
Time (Hours)
500
1000
1500
2000

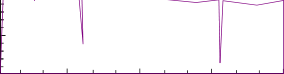
Sept 11th 2006
Data Integrity Operations
When acquiring data across local networks the Keynes Controls software checks and automatically maintains the data integrity of any measurements. Before data is archived it is verified to be correct and any mistake in a value is recovered from the specified instrument before data storage.
Data Summary Plots
Most types of data analysis can be undertaken when the information is archived within the database. This analysis can be as simple as detecting and reporting missed data, statistical analysis upon a range of measurements and all results can be presented upon a range of summary plots both in local Windows and on web pages.


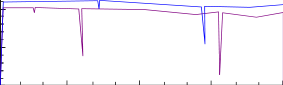
Monthly Summary - Sensor Frequency Hz
Average Value - Sept 2006
Average Value -
Time (Days)
1
500
1000
1500
2000
Fig 28 - Daily Data Summary Plot
Fig 29 - Monthly Data Summary Plot